AI-Powered Product Roadmaps: 5 Practical Frameworks

I remember the sprint where three stakeholders insisted their feature was 'mission critical' and my spreadsheet looked like modern art. That day I started testing AI tools to cut through the noise. In this post I share what worked: five distinct frameworks that use AI to score, predict, and organize roadmap ideas — with hands-on notes, tool picks, and a realistic playbook you can follow.


Essential AI Tools Product Managers Should Try
When I build AI-powered roadmaps, I don’t look for one “magic” platform. In 2025 tool roundups, multi-tool stacks are common—so I integrate rather than replace. Two lists I keep bookmarked for further research are the “11 best product roadmap tools” and the “Top-21 AI tools for product managers” guides. They both point to the same pattern: mix ideation, feedback, scoring, and dashboard tools for automated roadmap creation.
Quick comparison: AI tools for roadmap planning
| Tool | Primary Use | Strength | Example Output |
|---|---|---|---|
| ChatGPT | Ideation + prompt scoring | Fast synthesis | RICE draft + risks list |
| Zeda.io | Feedback clustering | Theme detection | Top 5 request clusters |
| Userpilot | In-app feedback + segmentation | Contextual insights | Friction points by persona |
| Airfocus | Evidence-based prioritization | Scoring workflows | Weighted score table |
| ProdPad | Roadmap + discovery | Linking ideas to evidence | Opportunity → feature map |
| BuildBetter.ai | Predictive dashboards | Progress monitoring | Release risk signals |
| Productboard | Roadmap dashboards | Customer-driven planning | Priority view by segment |
| Airtable | Data orchestration | Flexible workflows | Unified roadmap database |
| Contentsquare | Product analytics | Behavior insights | Journey drop-off report |
Start small: integrate one feedback channel with an AI model before scaling. — Productboard
Automatic feedback organization reveals what customers truly ask for. — Airfocus
How I pilot Essential AI tools product managers actually keep
My practical tip: run a two-week experiment connecting one feedback source (Zeda.io or Userpilot), one analytics source (Contentsquare), and one model (ChatGPT). I ask the model to summarize themes, propose a score, and explain tradeoffs in plain language. If I see measurable priority shifts (fewer debates, faster decisions), I expand the stack with Best product roadmap tools like Airfocus/ProdPad for scoring and Productboard/BuildBetter.ai for dashboarding.
SVG: capability comparison (6 tools)
<svg xmlns="http://www.w3.org/2000/svg" width="760" height="320" viewBox="0 0 760 320">
<rect width="100%" height="100%" fill="#fff"/>
<text x="20" y="28" font-family="Arial" font-size="14">Core capabilities count (0–3) per category</text>

<g font-family="Arial" font-size="11">
<text x="20" y="60">ChatGPT</text>
<rect x="120" y="48" width="30" height="10" fill="#D1D8DC"/><rect x="120" y="62" width="60" height="10" fill="#00E2B1"/><rect x="120" y="76" width="30" height="10" fill="#CCD7E6"/><rect x="120" y="90" width="90" height="10" fill="#41B8DD"/>

<text x="20" y="110">Zeda.io</text>
<rect x="120" y="98" width="60" height="10" fill="#D1D8DC"/><rect x="120" y="112" width="60" height="10" fill="#00E2B1"/><rect x="120" y="126" width="30" height="10" fill="#CCD7E6"/><rect x="120" y="140" width="90" height="10" fill="#41B8DD"/>

<text x="20" y="160">Airfocus</text>
<rect x="120" y="148" width="30" height="10" fill="#D1D8DC"/><rect x="120" y="162" width="60" height="10" fill="#00E2B1"/><rect x="120" y="176" width="60" height="10" fill="#CCD7E6"/><rect x="120" y="190" width="90" height="10" fill="#41B8DD"/>

<text x="20" y="210">ProdPad</text>
<rect x="120" y="198" width="30" height="10" fill="#D1D8DC"/><rect x="120" y="212" width="30" height="10" fill="#00E2B1"/><rect x="120" y="226" width="60" height="10" fill="#CCD7E6"/><rect x="120" y="240" width="90" height="10" fill="#41B8DD"/>

<text x="20" y="260">BuildBetter.ai</text>
<rect x="120" y="248" width="30" height="10" fill="#D1D8DC"/><rect x="120" y="262" width="90" height="10" fill="#00E2B1"/><rect x="120" y="276" width="60" height="10" fill="#CCD7E6"/><rect x="120" y="290" width="90" height="10" fill="#41B8DD"/>

<text x="400" y="60">Productboard</text>
<rect x="520" y="48" width="60" height="10" fill="#D1D8DC"/><rect x="520" y="62" width="60" height="10" fill="#00E2B1"/><rect x="520" y="76" width="60" height="10" fill="#CCD7E6"/><rect x="520" y="90" width="90" height="10" fill="#41B8DD"/>

<text x="120" y="312" font-size="10">Legend: Feedback Clustering (#D1D8DC), Predictive Scoring (#00E2B1), Dashboarding (#CCD7E6), Integrations (#41B8DD)</text>
</g></svg>
Governance, Bias Mitigation, and OKR Alignment
AI can reduce stakeholder politics in prioritization, but I only trust it when I add governance. Without clear rules, the model becomes a loud opinion instead of a decision aid. As the Product Management Society puts it: “Governance turns a helpful AI suggestion into a reliable decision tool.”
Governance for Product roadmap alignment
I start by defining inputs (what counts, what doesn’t), setting a refresh cadence, and making auditing non-negotiable. This is how I keep Bias free prioritization realistic, not just a slogan.
- Input definition: OKR tags, customer impact, revenue, effort, risk, dependencies.
- Cadence: weekly for fast-moving teams; biweekly for stable portfolios.
- Human review gates: PM drafts → Eng/Design validate effort → Leadership checks strategy fit → Final publish.
- Auditability: log data sources, model version, and score changes over time.
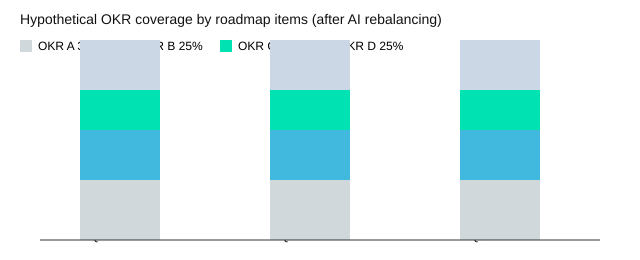
OKR alignment strategy and Portfolio alignment scoring
For OKR alignment strategy, I ask AI to map each roadmap item to strategic themes and quantify coverage. At portfolio level, AI helps me spot under/over-utilization (too many “big bets” in one quarter) and supports resource planning across teams. This Portfolio alignment scoring also improves OKR coverage and reduces qualitative resource overcommitment.
Explainability is the bridge between model output and stakeholder trust. — Contentsquare
Bias controls and explainable AI
- Diverse training data: include multiple segments, regions, and support channels.
- Human validation: reviewers challenge outliers and “too-perfect” scores.
- Transparency dashboards: show top drivers (impact, effort, risk reduction modeling) behind each score.
| Area | What I look for |
|---|---|
| Portfolio alignment benefits | Reduced resource overcommitment (qualitative); better OKR coverage (qualitative) |
| Governance steps | Input definition; Cadence (weekly/biweekly); Human review gates; Auditability |
| AI capability | Risk reduction modeling to adjust priority when delivery risk rises |
Playbook: From Pilot to Continuous Prioritization (Scenario Testing)
I treat AI prioritization like a weather forecast: it gets better as I add more sensors and feedback, and ignoring it is risky. The goal is to move from a small pilot to a Predictive analytics roadmap that updates as reality changes, using Scenario testing tools to reduce delivery risk before I commit teams.
Step 1: Pilot (4–8 weeks) — one source, one model, real scoring
I start small: I connect one feedback source (like support tickets or NPS comments) plus product analytics, then run a 4–8 week AI scoring test. During this pilot, I apply five frameworks side-by-side—RICE, WSJF, Opportunity Scoring, Kano, and Cost of Delay—then let AI translate inputs into Continuous scoring models I can compare week over week. This is my first step toward Automated roadmap creation, but I keep humans in the loop for final calls.
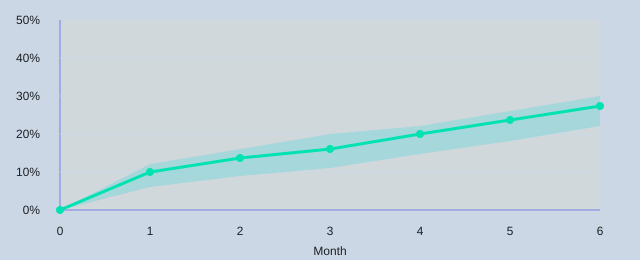
Step 2: Validate — compare predictions to telemetry and iterate
Pilots only matter if they validate AI predictions with real telemetry. For example, if I’m launching a personalization feature, the model might forecast adoption at Month1 18%, Month3 30%, and Month6 42% (illustrative). I then compare predicted adoption against early usage, activation, and retention signals. If telemetry is lower than expected, I adjust thresholds, weights, and data quality rules, and I rerun scenario testing to see what changes (scope, onboarding, performance) shift the forecast.
Scenario testing reveals hidden risk and opportunity before you commit dev cycles. — Airfocus
Step 3: Scale — integrate, govern, and treat it like a product
Once the model is stable, I integrate it into roadmap tools, add governance (data owners, review cadence, audit logs), and set OKRs for the prioritization engine itself. Continuous learning improvement is the point: the scoring should evolve as the market and product evolve.
Treat the prioritization engine like a product: give it KPIs and iterate. — BuildBetter.ai
| Item | Value |
|---|---|
| Pilot duration suggestion | 4–8 weeks |
| Adoption forecast example (illustrative) | Month1 18%, Month3 30%, Month6 42% |
| Five frameworks applied during pilot | RICE, WSJF, Opportunity Scoring, Kano, Cost of Delay |
By the end, I’m not “finishing” prioritization—I’m operating it. That’s how I keep my roadmap credible: forecast, validate, learn, and repeat.
TL;DR: AI can make roadmap prioritization objective and dynamic. Apply five frameworks (RICE, WSJF, Customer Value Prediction, Portfolio Alignment, Kano) with AI tools to score features, forecast impact, and align to OKRs.


Comments
Post a Comment